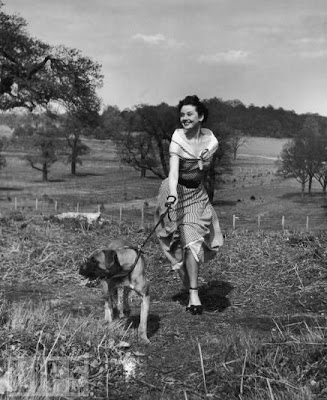
When Audrey walks her dogs, she follows an elegantly economical route to the park, pausing only to admire and be admired. But not Tozer and Chic. They're erratic and energetic, sniffing to the left, sniffing to the right, circling trees, running ahead or pulling back.
Tozer and Chic are Temperature Change and they are all over the place. Up one day and down the next. Without Audrey (Climate Change) they would get nowhere and we'd be seeing the same weather patterns our grandmothers saw.
However, Audrey is making sure they get to the park. The trouble is – the park is a wasteland of drought, extreme weather, rising sea levels and ocean acidification.
Check out this neat animation of a dog and his owner. It illustrates the difference between variance (i.e. weather) vs. trend (i.e. climate). It shows that there are hot years and cold years, but climate change is driving the graph upwards with more record highs than ever before.
Source: Video from Siffer, Teddy TV. Animator: Ole Christoffer Hager
And check out this 2-minute gem where Richard Alley graphs temperature change for different periods of his life. It shows the same upward trend. It's getting hotter.
And finally, I need to apologise to Audrey for making her the villain of this piece. To redeem myself, I invite you to enjoy some eye candy of the delightful Audrey Hepburn and her beloved dogs, none of which was called Tozer or Chic as far as I know.
 |
| Audrey in Rome with her dog called Famous. 1961. |
H/T Hager video: Climate Bites


